Debug
When you build the source code that you have created, four shared libraries are generated. These are the basement of your Web application. The TreeFrog application server (AP server) reads them during the startup, then waits for access from a browser.
Debugging the Web application is equivalent to debugging the shared common libraries. First of all, let’s compile the source code in debug mode.
In the application root directory, you can run the following command:
 $ qmake -r "CONFIG+=debug"
 $ make clean
 $ make
When debugging, the following settings are used according to the platforms:
In the case of Linux/macOS:
| Option | Value |
|---|---|
| Command | tadpole |
| Command argument | --debug -e dev (Absolute path of the app root) |
| LD_LIBRARY_PATH env variable (not needed on macOS) |
Specify the lib directory of web application. |
In the case of Windows:
| Option | Value |
|---|---|
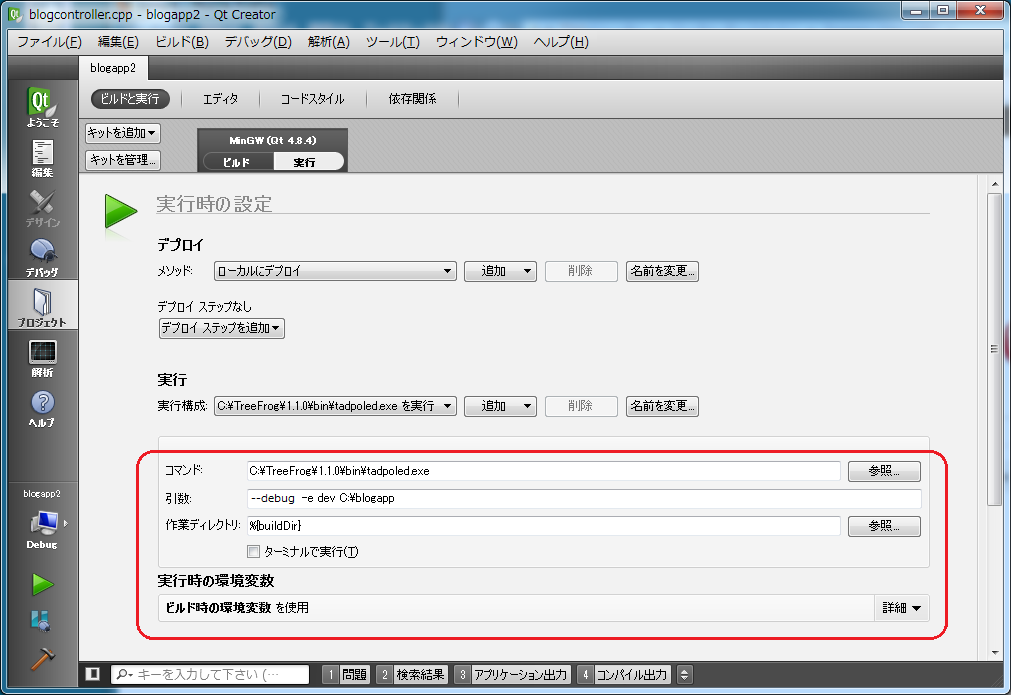
| Command | tadpoled.exe |
| Command argument | --debug -e dev (Absolute path of the app root) |
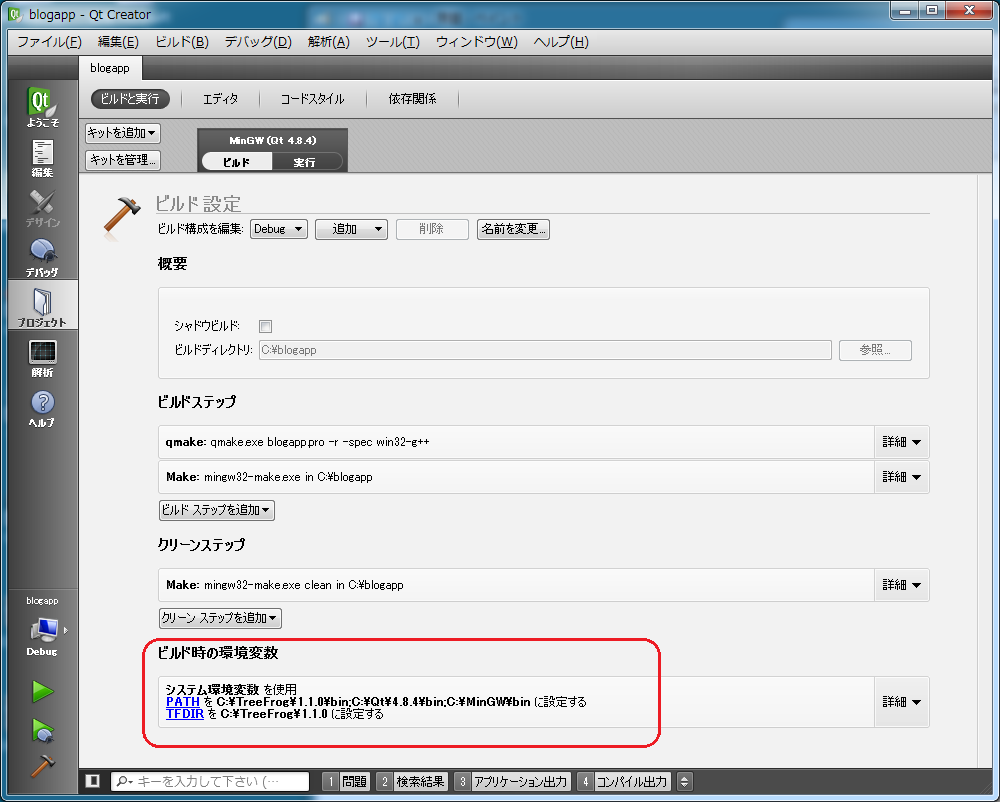
| PATH variable | Add TreeFrog’s bin directory C:\TreeFrog\x.x.x\bin at the beginning. Also, if you use something like MySQL or PostgreSQL, the directoryincluding the client DLL should also be added. |
| TFDIR variable | The TreeFrog directory is set, c:\TreeFrog\x.x.x. |
- x.x.x stands for the version of TreeFrog.
Next we are going to configure these items.
Debugging with Qt Creator
Let’s introduce debugging using the Qt Creator, I think the way you debug is basically the same with other debuggers.
First, make a thread in the MPM application configuration file.
MultiProcessingModule=thread
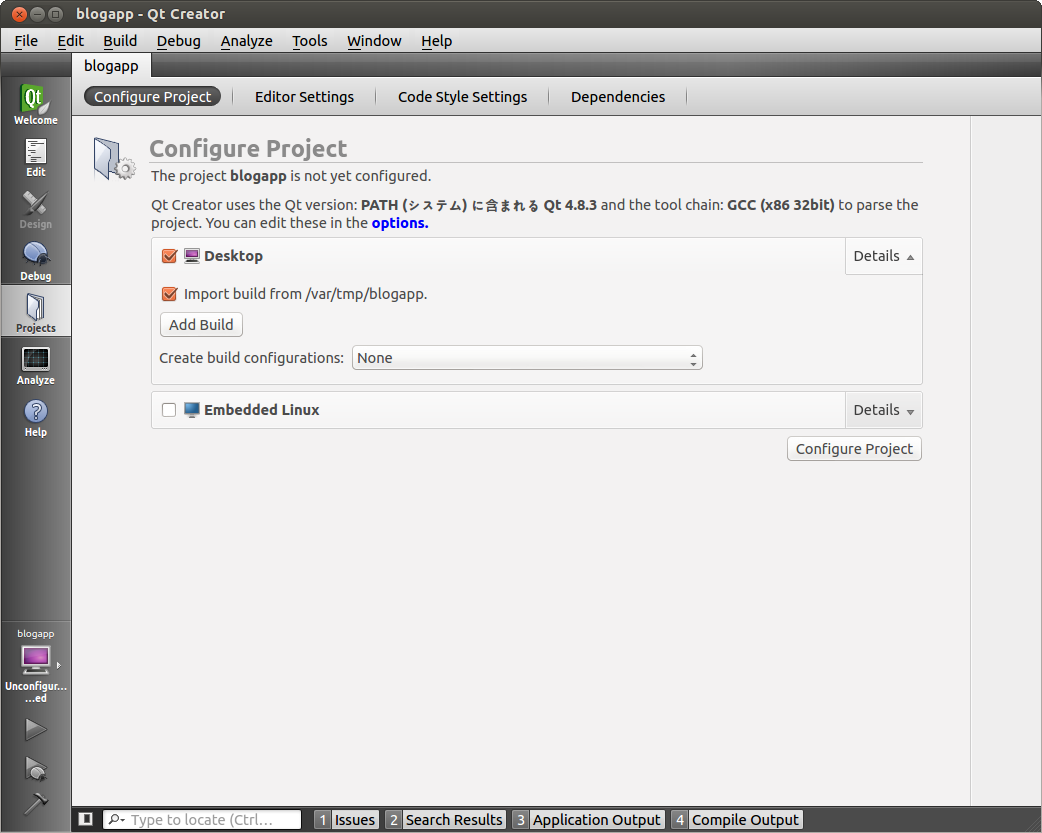
Import the source code of the application file to the Qt Creator. Then click [File] – [Open File or Project…] and then choose the project file on the file selection screen. Click the [Configure Project] button, and then import the project. The following screen is seen when the blogapp project has been successfully imported.

Now we will run the settings screen for debugging.
The last of the tadpole command arguments, specifies the -e option and the absolute path of application root. You may remember that the -e option is the option for switching the DB environment. Let’s assume you choose dev.
In the case of Linux:
In the next screen we choose /var/tmp/blogapp as the application root.
.png)
In Windows:
We can set the content in two ways by building the configuration screen and by implementing the configuration screen.
Example of a build configuration: (sorry for only having Japanese images for this demonstration…)

And an example of run configuration:

That is all about the configuration settings.
When adding a breakpoint to the source code, always try to access it from your Web browser.
Now check out whether the browser stops at the previously placed breakpoint. Does it stop at the there?
Debugging WebSocket with Qt Creator
To debug TreeFrog application containing WebSocket, modify Run Configuration of your project:
In the case of Linux/macOS:
| Option | Value |
|---|---|
| Command | treefrog |
| Command argument | -e dev (Absolute path of the app root) |
| Working directory | %{buildDir} |
In the case of Windows:
| Option | Value |
|---|---|
| Command | treefrogd.exe |
| Command argument | -e dev (Absolute path of the app root) |
| Working directory | %{buildDir} |
Now run the application [Build] – [Run] and then attach to tadpole process (tadpoled on Windows)
To attach to tadpole process in QtCreator click [Debug] – [Start Debugging] - [Attach to Running Application…]. It is possible to create a keyboard shortcut for this operation.


